a bit of personal archaeology by glyphobet, 16 July 2011
Phobos Labs posted a fascinating chart of nine years of sleep generated from nine years of IRC client logs. It got me wondering what long-lived data source I could use to generate a similar chart (since I don't use IRC). I've had the same primary e-mail address for about eleven years, so my sent email seemed like a plausible candidate.
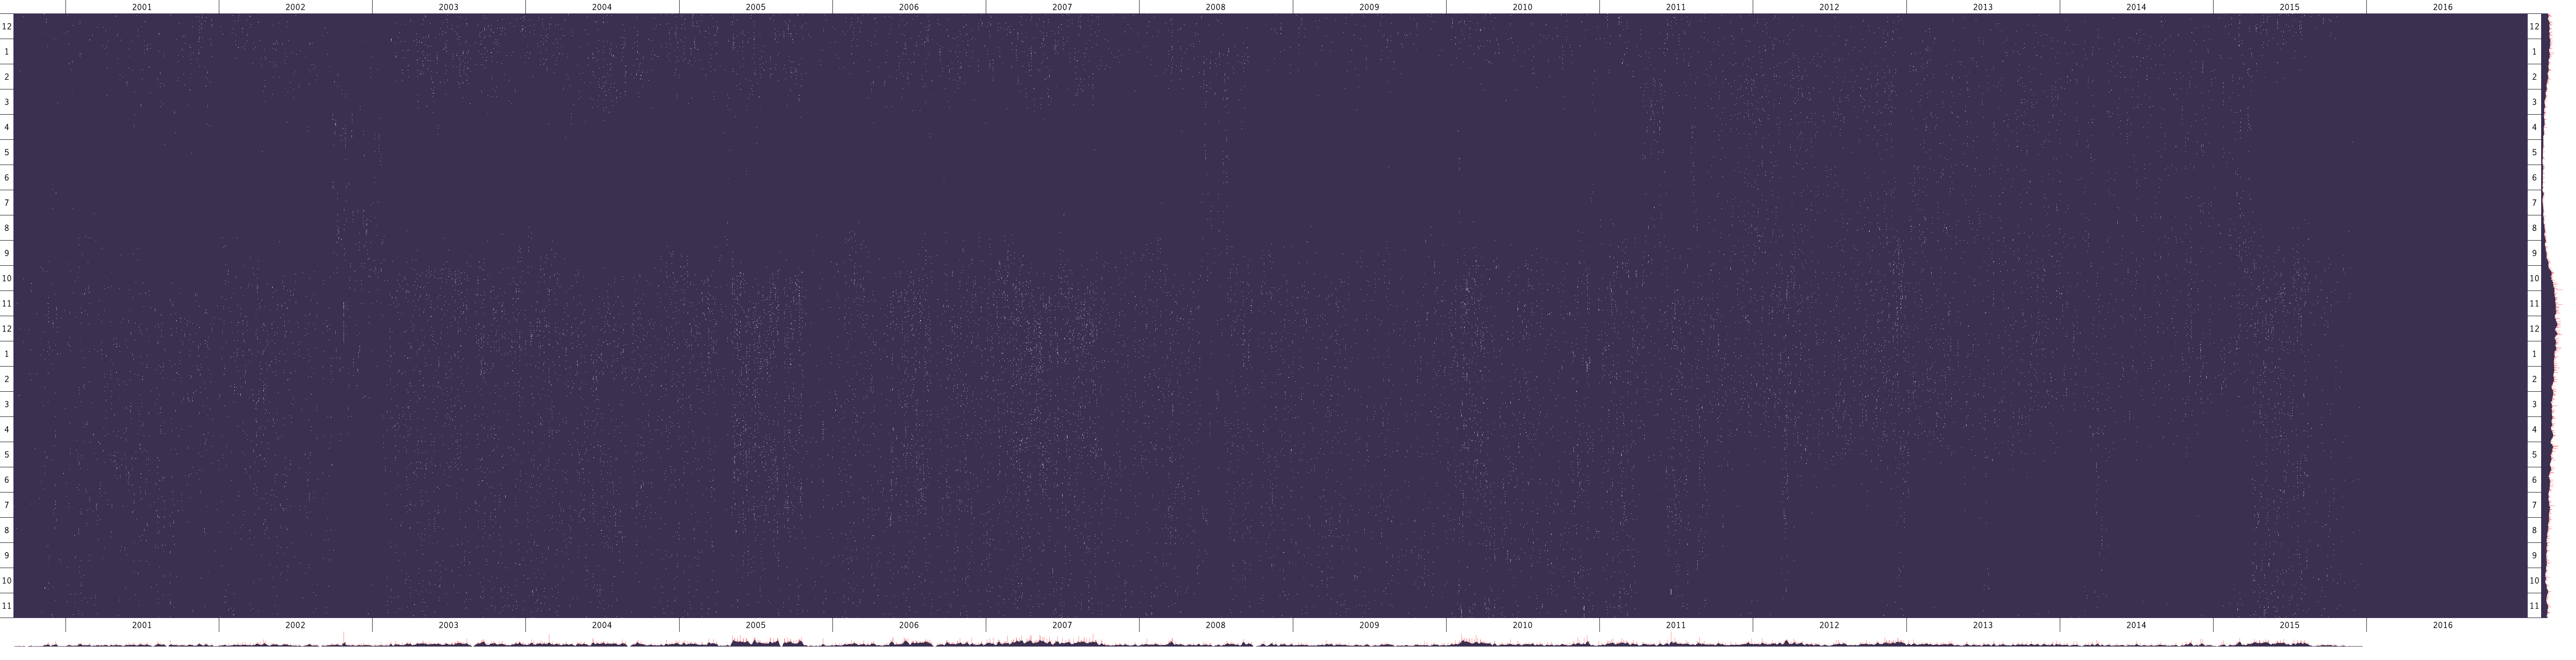
Here's the result: over eighteen thousand emails, or about eleven years of email. Click on the image for the full-size () version. iOS users can click here to see the chart.
The main body of the chart is a scatterplot. The vertical axis is minutes, and the horizontal axis is days. Each pixel in the scatterplot represents a minute. A white pixel means an email was sent in that minute. I rarely, if ever, send more than one email per minute.
The bottom of the chart is a histogram of days. Red is the raw histogram; overlaid on that is a rolling seven day average histogram.
The right side of the chart is a histogram of hours. Red is the raw histogram; overlaid on that is a rolling eleven minute average histogram.
There are a number of interesting patterns in the data. Looking first at the hourly histogram, I tend to start emailing around 10am, am most active in the next few hours, have dips in activity around 3:30pm (post-lunch food-coma) and 10:30pm (post-dinner food-coma), and rarely get to sleep before 2am. The dearth of emails early in the morning is a bit misleading; since college I've had a practice of tackling the hardest mental problems immediately after waking up; this means I tend to put off morning email for an hour or two.
The daily histogram shows some events in my life. Until I finished grad school in mid-2002, this was a secondary email account, and I was without DSL until early 2003. My activity increases slowly over this period. In mid-2005 I used this account for work as well as personal email; in late 2005 the company I was working for got us all company emails.
There are seven trips to Burning Man, which generally means no email whatsoever for seven to nine days. There are four trips to Europe and one to Asia, where the hourly pattern is seven to eight hours off. Four days without any sort of email on a sailboat in the Mediterranean, in the middle of the 2008 Europe trip, are also visible. And, lest this sound like bragging, there's also a multi-day hospital stay after breaking my leg in late 2008.
On the scatterplot itself, there is a faint pattern of waking up and going to bed earlier in the winter than in the summer. There's also a slight trend towards waking up and getting to bed earlier as the years have gone on, which must mean I'm getting old.
The chart is updated every day. It will be interesting to see how it changes, and what patterns emerge, over the coming years.
The long timespan is only possible because I was careful to convert mutt's sent-mail mbox into a Maildir when my host switched to Maildir and IMAP.
The chart is generated by a Python program that reads a local Maildir and uses PIL to draw the graphs. It's fully timezone-savvy, supporting not only offsets on the sent mail times but, if you have the pytz library installed, rendering the actual chart in any timezone you like. The program is set up to be run as a cron job so the chart can be updated automatically. The font is Inconsolata. You can get the code and generate a chart of any of your own Maildirs on BitBucket or Github.